
Flying in the U.S. is becoming more expensive, and more stressful, than ever.
New data from the Bureau of Transportation Statistics shows that average airfare across the country’s busiest airports now exceeds $400 at several major hubs.
At the same time, rising fuel costs, and global uncertainty are putting additional pressure on airlines, and travelers.
But price isn’t the only issue. Long TSA security lines tied to ongoing staffing shortages, growing safety concerns, and operational disruptions are reshaping how Americans approach air travel in 2026.
To better understand the current state of flying, LocalsInsider.com analyzed newly released federal airfare data across the 50 busiest U.S. airports and surveyed 1,500 Americans about their travel habits, budgets, and concerns.
Highlights:
- 63% of Americans expect to fly less in 2026 due to rising airline costs, signaling a major shift in travel behavior.
- 68% say flying is becoming unaffordable for them personally, while an overwhelming 93% believe it’s less affordable for the average American.
- Rising costs are already impacting plans: 53% have delayed or postponed a trip
- 47% have booked earlier than usual to avoid price increases.
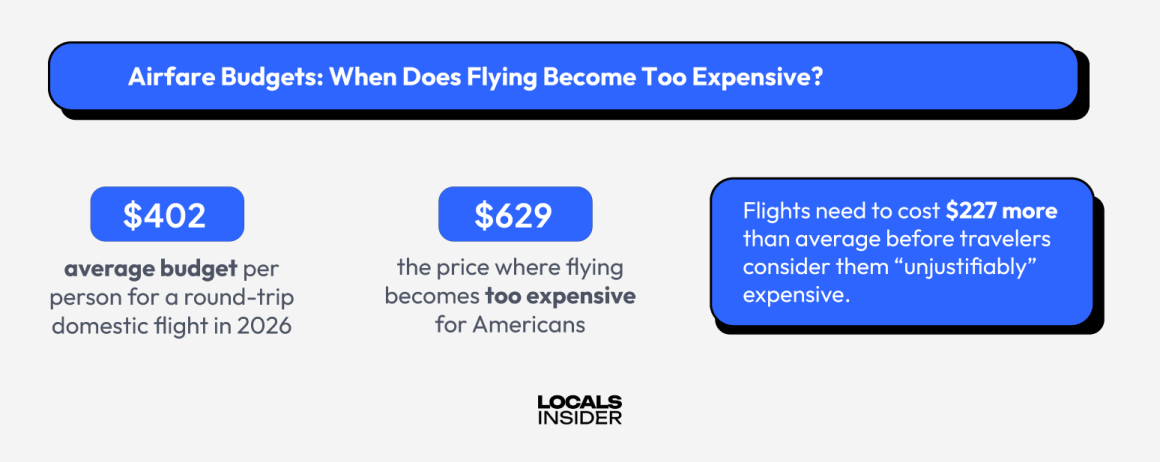
- The average domestic round-trip airfare budget is $402 per person, but flights become unjustifiably expensive at $629, which is a gap of roughly $227.
- Washington Dulles International Airport ranks as the most expensive airport in the U.S., with an average airfare of $439.39, followed by Salt Lake City and Charlotte.
- The average traveler considers 45 minutes the tipping point for an unacceptably long security line.
Flying in America Is Becoming Unaffordable
Flying is quickly becoming a luxury rather than a routine form of travel for many Americans.
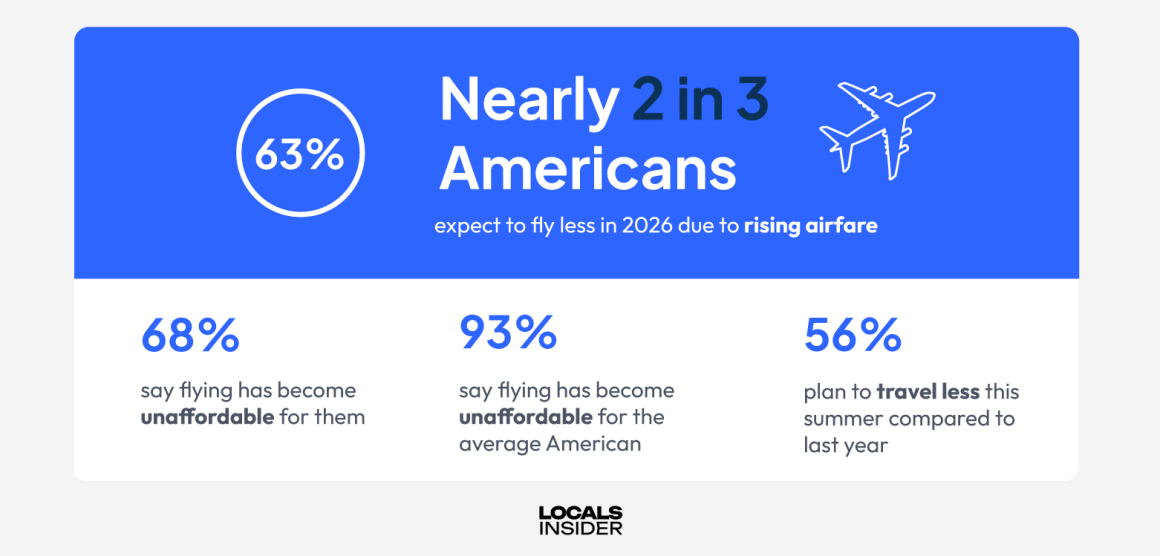
Nearly 2 in 3 Americans (63%) say they expect to fly less in 2026 due to rising airfare, a clear sign that increasing costs are already reshaping travel behavior.
Overall, 68% of Americans say flying is becoming unaffordable for them personally, while an overwhelming 93% believe it’s becoming less affordable for the average American.
Looking ahead to the peak travel season, a majority (56%) of Americans say they plan to travel less this summer compared to last year, which is a sign that rising costs are already affecting seasonal demand.
As airfare continues to climb, travelers are being forced to make tougher decisions, whether that means flying less, delaying trips, or reconsidering travel altogether.
How Rising Airfare Is Changing Travel Plans
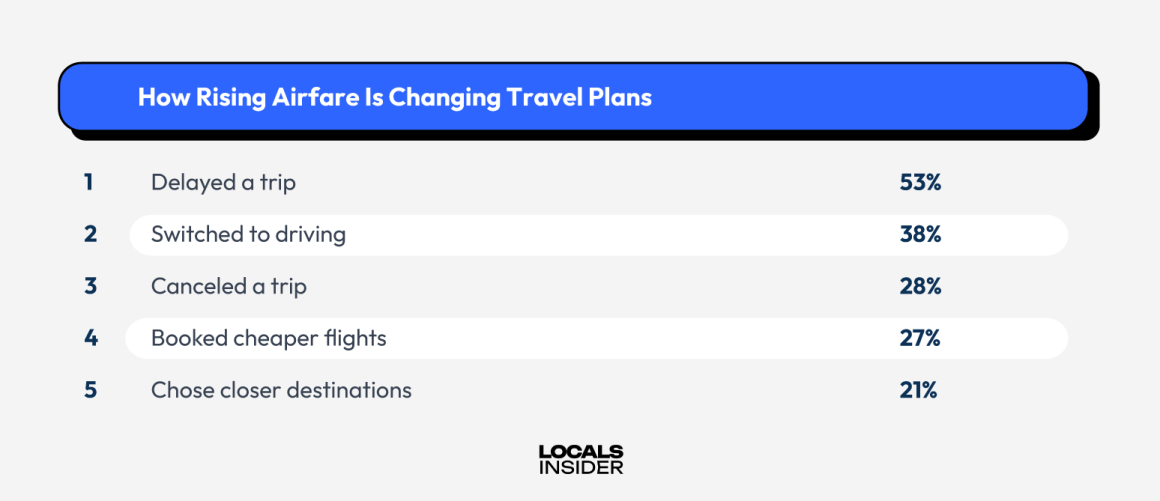
Rising airfare is actively changing how Americans plan and take trips.
More than half of travelers say they’ve already adjusted their plans, with 53% delaying or postponing a trip due to rising costs. Others are making more drastic changes to avoid high ticket prices such as switching to driving instead of flying (38%), and even canceling a trip entirely (28%).
Beyond where and how they travel, Americans are also changing when they book. Overall, 47% say they’ve booked flights earlier than usual to avoid further price increases, while 38% have considered booking multiple trips in advance to lock in current fares.
It’s clear travelers aren’t just reacting to higher prices, they’re actively trying to stay ahead of them.
What Americans Are Willing to Pay for Flights in 2026
As airfare rises, there’s a clear limit to what travelers are willing to spend.
On average, Americans report a typical round-trip domestic airfare budget of $402 per person. However, that threshold doesn’t stretch much further. Once ticket prices reach $629, travelers say flights become “too expensive” to justify.
That means airfare only needs to increase by about $227 above the average budget before travelers begin reconsidering whether to fly at all.
This relatively narrow margin highlights just how sensitive travelers are to price increases. Even modest jumps in airfare can push trips out of reach, especially for families or frequent travelers booking multiple tickets.
As airlines continue to face rising fuel costs and operational pressures, that gap between affordability and reality may only continue to widen.
Ranked: The Most Expensive Airports in America
Airfare costs aren’t rising evenly across the country. Some airports are significantly more expensive than others.
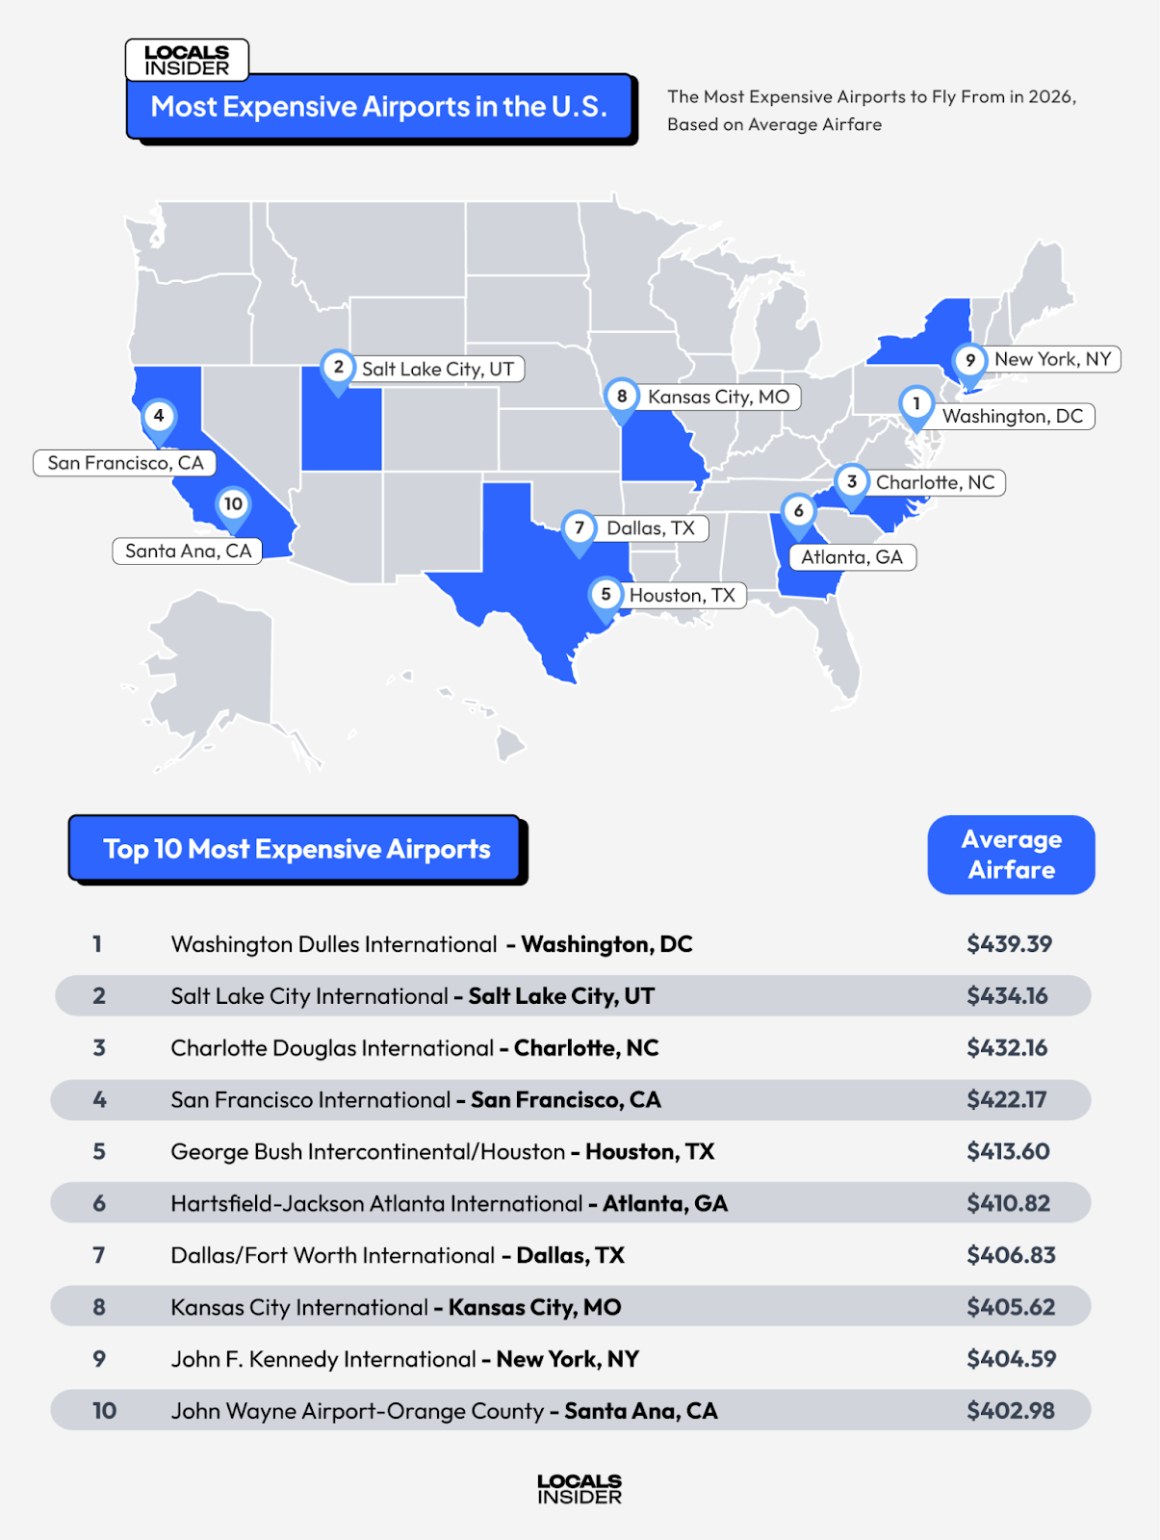
Based on the latest data from the Bureau of Transportation Statistics, several major U.S. airports now average more than $400 per domestic ticket, with a handful standing out as the most expensive in the nation.
Washington Dulles International Airport ranks as the most expensive airport in the U.S., with an average airfare of $439.39. It’s followed closely by Salt Lake City International ($434.16) and Charlotte Douglas International ($432.16).
Notably, the list includes a mix of major hub airports and high-demand travel markets, including:
San Francisco International ($422.17)
George Bush Intercontinental/Houston ($413.60)
Hartsfield-Jackson Atlanta International ($410.82)
Dallas/Fort Worth International ($406.83)
John F. Kennedy International ($404.59)
Across all top 10 airports, average airfare exceeds $400, reinforcing just how widespread elevated pricing has become.
Long Lines, Short Staffing, and Growing Safety Concerns
Cost isn’t the only factor reshaping air travel, the airport experience itself is also becoming more unpredictable.
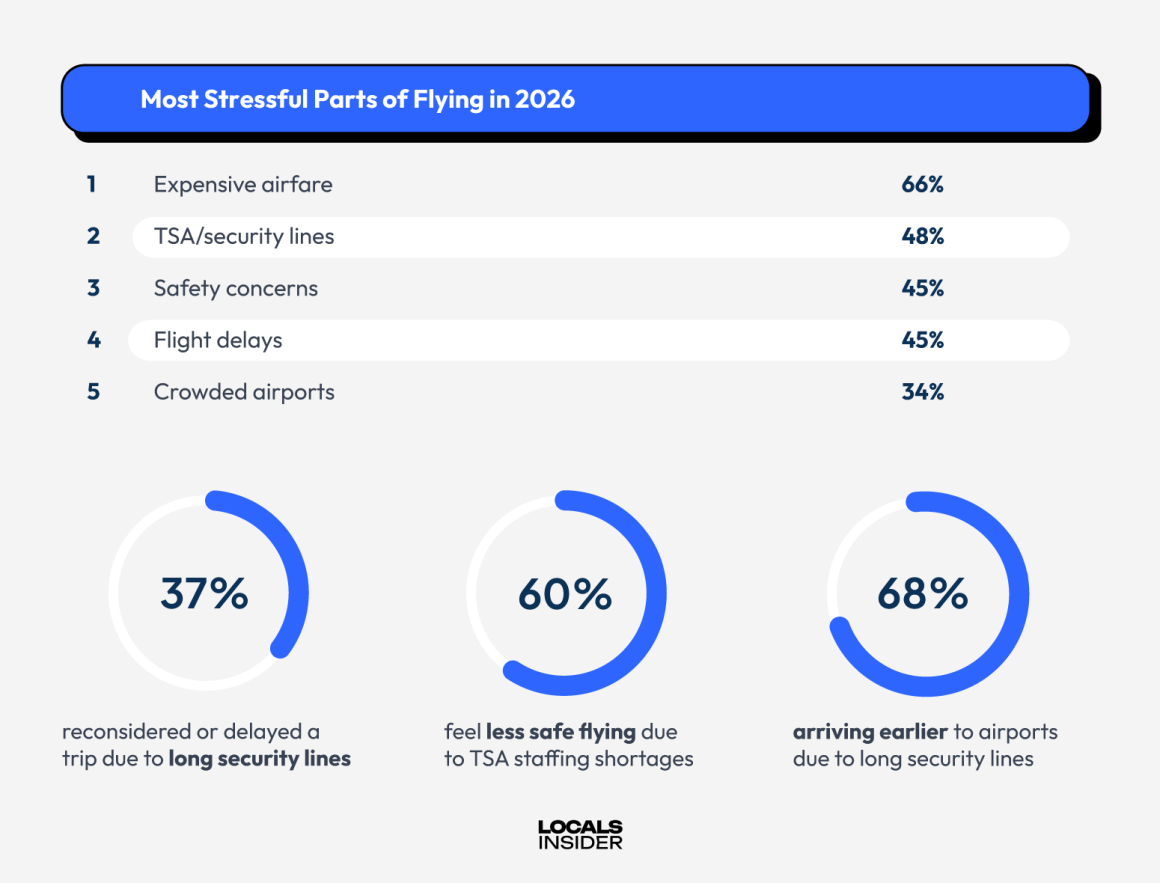
Ongoing TSA staffing shortages are contributing to longer security lines and increased traveler frustration. As a result, 37% of Americans say they’ve reconsidered or delayed a trip due to long TSA wait times, while 68% say they are arriving earlier than usual to account for delays.
Overall, the average American considers 45 minutes to be the maximum acceptable wait time for airport security before it becomes too long.
These operational challenges are also impacting how safe travelers feel, with 60% saying TSA staffing shortages make them feel less safe when flying, and 73% feeling less safe flying internationally right now.
Meanwhile, broader changes to airport security are also shaping public opinion. Two-thirds (66%) of Americans say ICE agents should not be deployed at airports, and 39% believe TSA agents should be replaced with private security companies.
All of this is contributing to a more stressful travel experience overall. Today, expensive airfare ranks as the No. 1 stressor for travelers (66%), followed by TSA lines (48%), safety concerns (45%), and flight delays (45%).
As costs rise and airport conditions remain strained, flying in 2026 is becoming not just more expensive, but more complicated and uncertain.
Methodology
In March 2026, we surveyed 1,500 Americans to ask a series of questions about their current air travel habits, including how rising airfare costs are impacting their travel plans, how much they typically budget for flights, and at what point ticket prices become too expensive to justify.
The survey also explored how travelers are adapting to ongoing changes in air travel, including whether they are flying less, booking flights earlier, or choosing alternative transportation methods. Additional questions examined traveler sentiment around airport conditions, including TSA wait times, staffing shortages, and overall safety concerns when flying domestically and internationally.
To complement the survey findings, Locals Insider analyzed newly released airfare data from the Bureau of Transportation Statistics across the 50 busiest airports in the United States. Average domestic airfare was used to identify and rank the most expensive airports in the country.
Fare calculations include the total ticket value, which consists of: The price charged by airlines, taxes and fees imposed at the time of purchase. Excluded from averages: Additional fees paid at the airport or onboard (e.g., baggage fees), frequent-flyer or “zero fares,” and abnormally high reported fares.
The top 50 airports were ranked by U.S.-originating domestic passengers according to BTS data.
Survey Demographics
Gender: Female (58%); Male (40%); Non-binary (2%)
Age Range: 18 – 79 (average: 38 years old)
Household Income Distribution: Under $20,000 (7%); $20,000 – $40,000 (12%); $40,001 – $60,000 (15%); $60,001 – $80,000 (17%); $80,001 – $100,000 (13%); Over $100,001 (36%)
Limitations: Self-reported survey data may be subject to recall bias or social desirability bias.
Sources: U.S. Bureau of Transportation Statistics, U.S. Bureau of Labor Statistics Consumer Price Index (CPI).
If you travel business, check out the best lounges that you can use and the list of travel apps and gadgets that may help you on the way during your long-haul flight.